
Corn Test Weight
To understand test weight, we must first understand the measurement of a bushel. The bushel measurement originated in Winchester, England during the 17th century. It was created to standardize volumes within the grain trade, and is sometimes referred to as the “Winchester Bushel.” In 1696, the Winchester bushel measurement was amended to its current volume of 2,145.6 cubic inches. The initial U.S. bushel was modeled after the Winchester bushel and defined as 2,150.42 cubic inches, or a volume equivalent to 32 U.S. quarts. The modern U.S. bushel is based solely on an established weight for each commodity that is bought and sold on a bushel basis, and does not consider volume. For yellow corn, the weight per bushel was set at 56 pounds at 15.5% grain moisture.
Overview & History of Test Weight
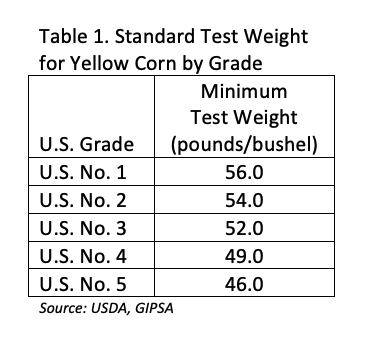
If a modern bushel is defined as 56 pounds of corn at 15.5% grain moisture, then what is test weight? Test weight is a measurement of bulk density, or weight per volume. For corn specifically, test weight is determined by measuring the weight of shelled grain (at 15.5% moisture) required to fill the volume area equivalent to that historical, volume-based bushel (32 quarts). The USDA designates 5 grades by which yellow corn is categorized based on test weight (see Table 1). Grading of corn also includes variables such as damaged kernels and foreign material, but for our purposes here we will focus on only test weight.
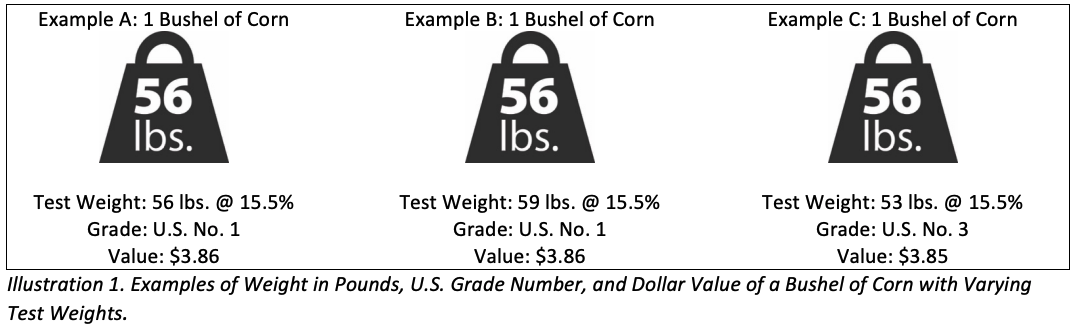
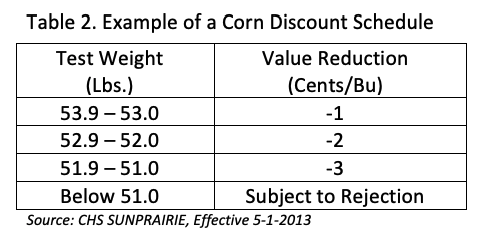
The examples shown below, in Illustration 1, represent a bushel (56 pounds) of corn with a range of three possible test weights. For each example test weight, it shows the U.S. Grade and the dollar value using CBOT closing corn price on March 15, 2018 ($3.86) and an example discount schedule for test weight variance (see Table 2).
Another way to visualize the relationship between weight and volume is to consider how much space a bushel of corn takes up at varying test weights. The examples in Illustration 2 represent this comparison and are based on the same set of test weight values used in Illustration 1. Illustration 2 provides an excellent visualization of the difference between a bushel of corn (56 pounds) and the corresponding volume of grain contained in that bushel as test weight varies. The dollar value for each example bushel is again based on CBOT closing corn price on March 15, 2018 ($3.86) and an example discount schedule for test weight variance (See Table 2).
Test Weight & Grain Value
When corn test weight is below 54 pounds, the grain merchandiser may pay less for those bushels. This value reduction is referred to as “dockage,” and is applied to recover increased storage and transportation cost for that grain, and to cover potential discounting (based on U.S. Grade) by the eventual purchasing party. The specific value of dockage will vary by merchandiser. The value of each respective bushel shown in Illustrations 1 and 2 are based on the Discount Schedule shown in Table 2.
Test Weight & Grain Moisture
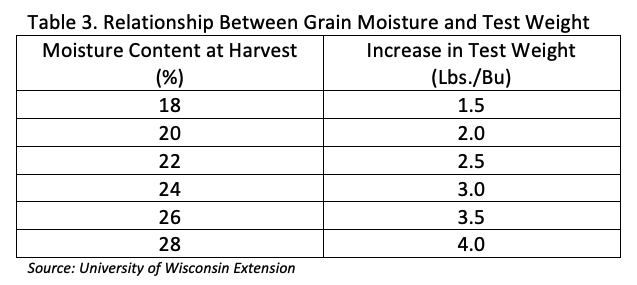
The test weight value used to determine U.S. Grade (Table 1.) is a measure of corn bulk density (weight by volume) at 15.5% moisture. Corn is often sold at a grain moisture content above, or sometimes below, 15.5% moisture. The test weight of grain at 15.5% moisture will be higher (heavier) than it is at higher grain moisture contents. Table 3 shows the relationship between grain moisture content and test weight, and provides the values by which test weight will increase as grain dries from higher grain moisture contents down to 15.5%.
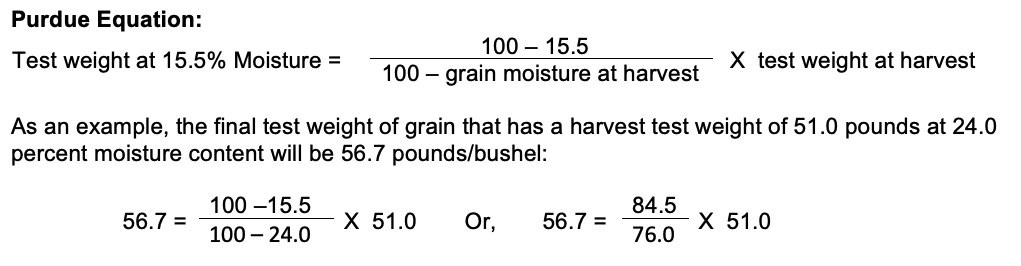
Another method for calculating test weight at 15.5% is shown in the equation below. This equation uses the grain moisture and test weight at harvest to calculate test weight at 15.5%, and is from an article published in Purdue’s September 2014 Agronomy Newsletter.
Test Weight & Yield
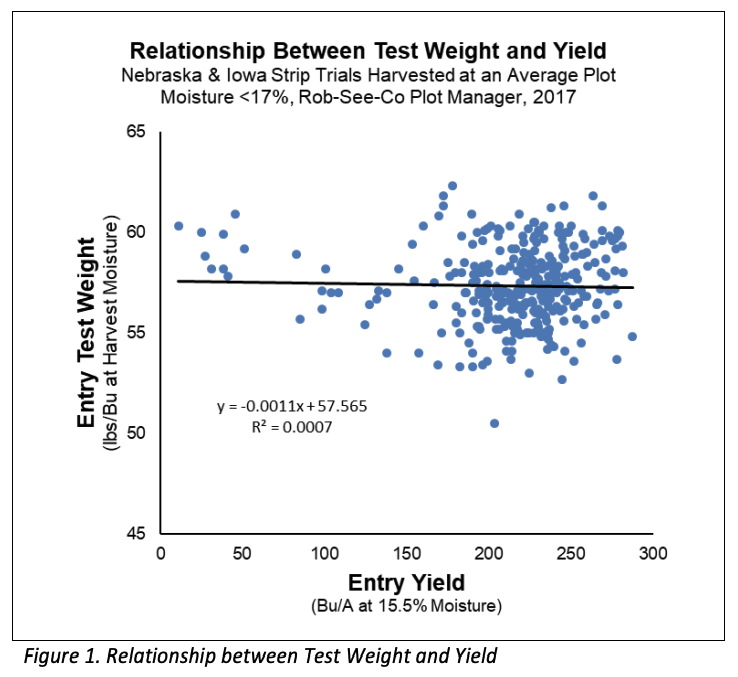
There is often confusion between test weight and yield, and the relationship between the two. Hybrid yield is defined as the number of bushels (56 pound increments) harvested per acre. There is no correlation between hybrid yield and test weight. A hybrid with the capability to produce high yields may produce grain with a test weight that is exceptionally high, average, or very low.
Figure 1 shows the relationship, or lack of, between yield and test weight. It is based on Rob-See-Co strip trials harvested in Iowa and Nebraska in 2017. The horizontal, or flat, trend line means that yield and test weight are independent variables and not correlated. The R2 of near zero also supports a lack of correlation. We limited the dataset to trials with an average plot moisture content of less than 17.0%, so that the test weight values in the graph would be more reflective of test weight at 15.5% grain moisture. Including all strip trials would show the same relationship, but the test weight range would be lower due to the higher grain moisture contents at harvest (see section on Test Weight & Grain Moisture).
Variables Impacting Test Weight
The physical kernel characteristics inherent to a hybrid greatly impact test weight. For example, a small, dense kernel that packs together tightly will contribute to a higher test weight than a large starchy kernel that does not pack well. Also, kernels with a smooth cap will pack better (higher test weight) compared to kernels with a rough cap (average or lower test weight). The year to year consistency in an individual hybrid’s kernel characteristics allows Rob-See-Co to characterize hybrids for test weight. A hybrid with higher rating (a Rob-See-Co score of 7 or 8, for example) for grain test weight may produce grain with a 59 pound test weight during one growing season and 57 pound in the following season. In comparison, a hybrid with a more moderate rating (6 for example) for test weight might produce 57 and 54 pound grain in those same two growing seasons.
Despite the historical test weight trends of a given hybrid, stress during grain fill can negatively impact the potential test weight of a hybrid in any individual field. This reduction may result from many different types of stress, including leaf diseases, root or stalk rots, poor soil fertility, and/or drought, hail or early frost. These stresses reduce the amount of sugar produced by the plant and therefore how much is available to deposit as starch in the kernels during grain fill. The net result of this sugar production deficiency, or “short-fall” will be both smaller kernels and reduced test weight, with more severe stress resulting in a greater reduction.